")
")

Case Study: Russia-South Africa Trade
By Dr. Godwin E. Ibe (M.D., MSc. PhD.)
Chairman, NIDO Russia. Aspirant RUDN.
+7 926 238 5618/This email address is being protected from spambots. You need JavaScript enabled to view it.
Increasing intra-BRICS trading is seen as a positive goal by BRICS member countries today but how much time, energy, funds and effort is invested in intra-BRICS trading differs and there are lots of questions that need to be answered that can help to guide policy makers or government officials in deciding how much of these limited resources should be invested in increasing intra-BRICS trading.
Such questions include: Is intra-BRICS trading volume connected with socio-economic development in participating countries? Can intra-BRICS trading volume reliably predict socio-economic development in participating countries and can a model be created in this regard? Is population growth or decline in participating countries a hindrance to any potential socio-economic development from intra-BRICS trading? What are the opportunity costs? What socio-economic indicators are relevant? Secondary sources of data for this research include the World Bank, the Organisation for Economic Co-operation and Development (OECD) and the Observatory of Economic Complexity (OEC). Data was collected for the period 2011-2021. Bilateral trade between Russia and South Africa has increased by 16.4% in 2022 compared to the previous year and has reached US$1.3 billion. Direct shipping routes have now been established for the first time in over 30 years. As 6 new countries have been invited to join BRICS, this may affect the dynamics of trade and resultant effects on socioeconomic development. Increasing settlements in national currencies and potential launching of a common unified BRICS currency are other examples of policies that may affect intra-BRICS trade. These questions therefore need answers more than ever, and rather sooner than later.
Hypotheses:
- Intra-BRICS trading volume is connected with socio-economic development in participating countries.
- Intra-BRICS trading volume is connected with socio-economic development in participating countries.
- Intra-BRICS trading volume may moderately predict socio-economic growth rate in participating countries
- A model can be created to predict socio-economic development based on Intra-BRICS trading volume
- Population growth or decline in participating countries is not a hindrance to any potential socio-economic development from intra-BRICS trading.
- The opportunity cost of investing in Intra-BRICS trading volume is low.
As per relevant socio-economic indicators, the following were chosen: Gross domestic product (GDP) purchasing power parity (PPP), GDP per capita PPP, GDP PPP growth and GDP per capita PPP growth. GDP per capita PPP is an important indicator of the size of the economy. GDP per capita PPP is an important indicator of the wealth of each citizen and it is also sensitive to population size because it is gotten by dividing the GDP by the population. GDP PPP growth and GDP per capita PPP growth are important indicators of the of the dynamics of socioeconomic development especially in relation to changes in the Total trade volume between South Africa and Russia. These 4 socio-economic indicators were considered for both Russia and South Africa. "Total trade volume" was chosen over "Balance of payment" for several reasons. A country with zero balance of payment might seem to be faring better than a country with a negative balance of payment at first glance, but this may not be the case as a country with a negative balance of payment may have a larger economy and those goods or services imported which exceeds exports may be channelled into internal production/consumption or exports to other countries.
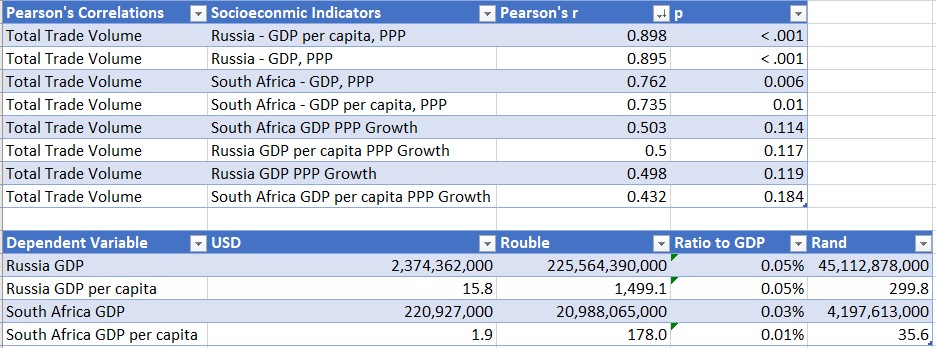
Concerning correlation, the research showed that total trading volume was strongly correlated with many factors and moderately correlated with others. These correlations will be listed according to the order of significance from top to bottom.
Total trade volume was most strongly correlated to Russia's GDP per capita PPP with a Pearson's r value of 0.898. A p value of less than 0.001 indicates that the results are of very important statistical significance and the null hypothesis should be rejected.
Total trade volume was strongly correlated to Russia's GDP PPP with a Pearson's r value of 0.895. A p value of less than 0.001 indicates that the results are of very important statistical significance and the null hypothesis should be rejected.
Total trade volume was strongly correlated to South Africa's GDP PPP with a Pearson's r value of 0.762. A p value of 0.006 indicates that the results are of very important statistical significance and the null hypothesis should be rejected.
Total trade volume was strongly correlated to South Africa's GDP per capita PPP with a Pearson's r value of 0.735. A p value of 0.01 indicates that the results are of very important statistical significance and the null hypothesis should be rejected.
Total trade volume was moderately correlated with South Africa's GDP PPP growth with a Pearson's r value of 0.503. A p value of 0.114 indicates that no effects were observed and the null hypothesis can be considered.
Total trade volume was moderately correlated with Russia's GDP per capita growth with a Pearson's r value of 0.5. A p value of 0.117 indicates that no effects were observed and the null hypothesis can be considered.
Total trade volume was moderately correlated with Russia's GDP growth with a Pearson's r value of 0.498. A p value of 0.119 indicates that no effects were observed and the null hypothesis can be considered.
Total trade volume was moderately correlated with South Africa's GDP per capita growth with a Pearson's r value of 0.432. A p value of 0.184 indicates that no effects were observed and the null hypothesis can be considered.
These results answer some of the questions which were put forward and proves some of the hypotheses (1,2,3 & 5) put forward to be true. Intra-BRICS trading volume is connected with socio-economic development in participating countries. Intra-BRICS trading volume is connected with socio-economic development in participating countries. Intra-BRICS trading volume may moderately predict socio-economic growth rate in participating countries but not in all cases. Population growth or decline in participating countries is not a hindrance to any potential socio-economic development from intra-BRICS trading.
The research was able to establish how much each change in Total trade volume affected some of the socio-economic indicators. For every 1 million USD (US$1,000,000) increase in Total trade volume, Russia's GDP PPP increases by about 2.4 billion dollars (equivalent to 225 billion roubles or 45 billion rands at today's exchange rates), Russia's GDP per capita PPP increases by about US$16 (equivalent to about 1500 roubles or 300 rands at today's exchange rates), South Africa's GDP PPP rises by 221 million US dollars (equivalent to about 21 billion roubles, or 4 billion rands at today's exchange rates), South Africa's GDP per capita PPP rises by about 2 US$ (equivalent to 178 roubles or 36 rands at today's exchange rates). Hypothesis 4 is therefore true.
Since Total trade volume can reliably predict socio-economic development both at national and citizen level in a positively correlated fashion, it is therefore a safe bet for policy makers or government officials (especially conservatives) who want socio-economic development with low risks. The opportunity cost of investing in Intra-BRICS trading volume is low due to low risks, high returns and high predictability of investment. Hypothesis 6 is therefore true.
There are some limitations to this research and therefore future areas of research. Extra-BRICS trading was not analysed. Only trade between 2 BRICS members were considered (Russia and South Africa). Other trading indicators, such as balance of payment were not analysed in depth. Geopolitical changes in 2022 till date were not analysed, but considering the fact that these indicators were taken over a sufficiently long period of time (including during the COVID 19 pandemic), we assume confidence in the data and ability of the resulting models to predict socio-economic development beyond 2021. Means of data collection may be affected due to changes in Russia's membership in some organisations such as OECD.
References
- OECD (Organisation for Economic Co-operation and Development) (2021), https://data.oecd.org, retrieved on 31.08.2023.
- OEC (The Observatory of Economic Complexity), https://oec.world, retrieved on 31.08.2023.
- World Bank, World Development Indicators, https://data.worldbank.org, retrieved on 31.08.2023.
 - Russia & South Africa")
 - Russia & South Africa")